
Data Visualization: AIGA 2017 Census
Print, Interactive web piece (HTML/CSS) + P5.js
→ Using the AIGA 2017 Census to visually interpret the data as well as creating a narrative to tell the story of what we wish non-designers knew.

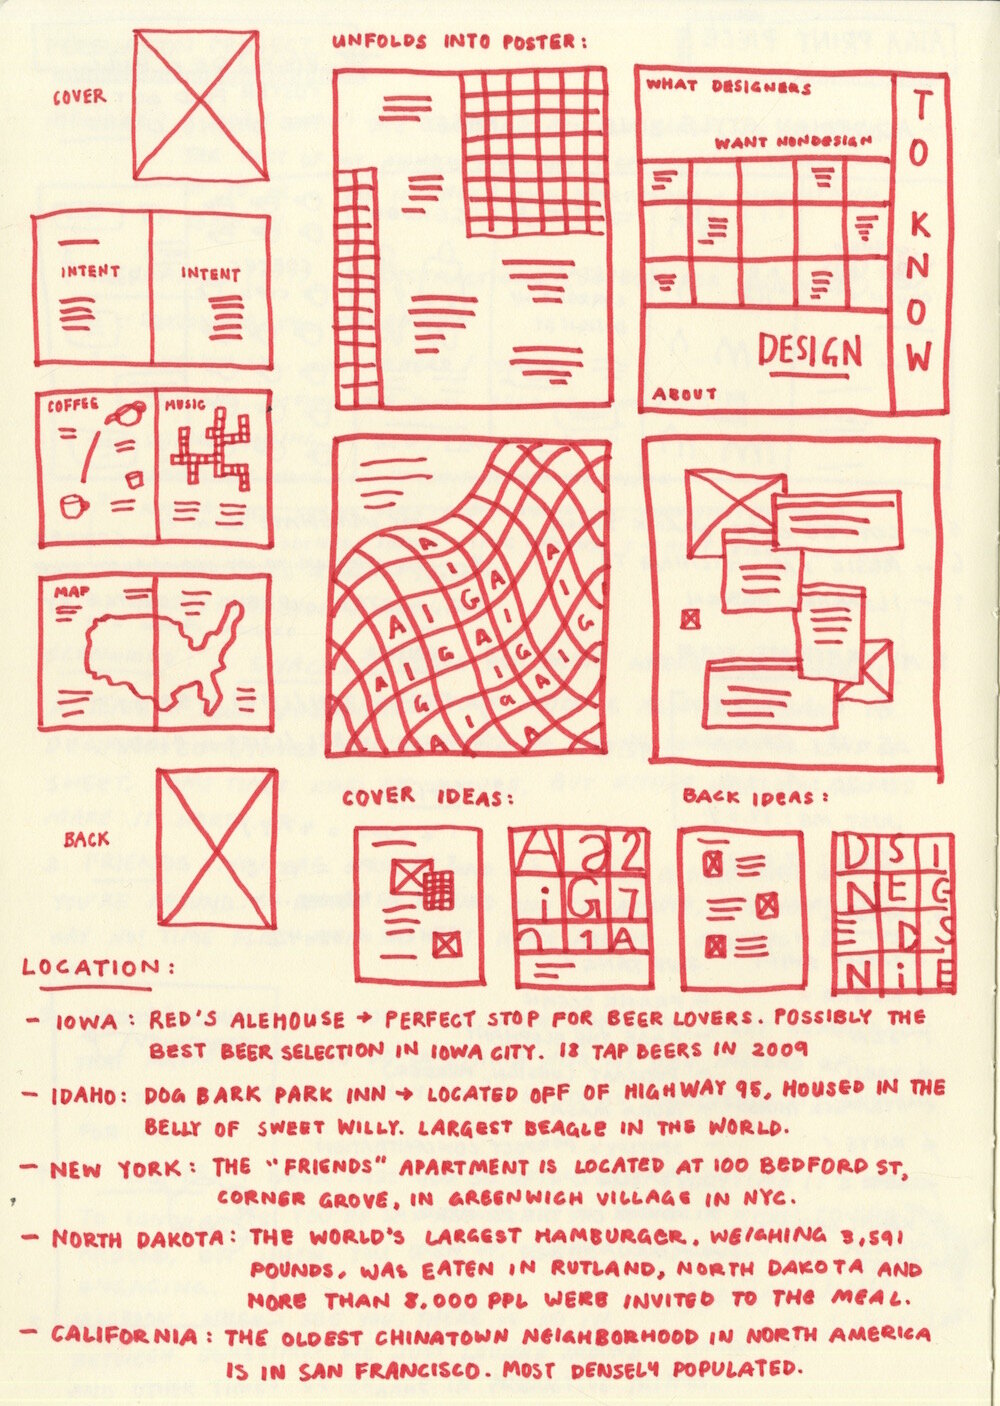
Print piece: 6″ x 8″ spreads, unfolds into 16″ x 24″ poster
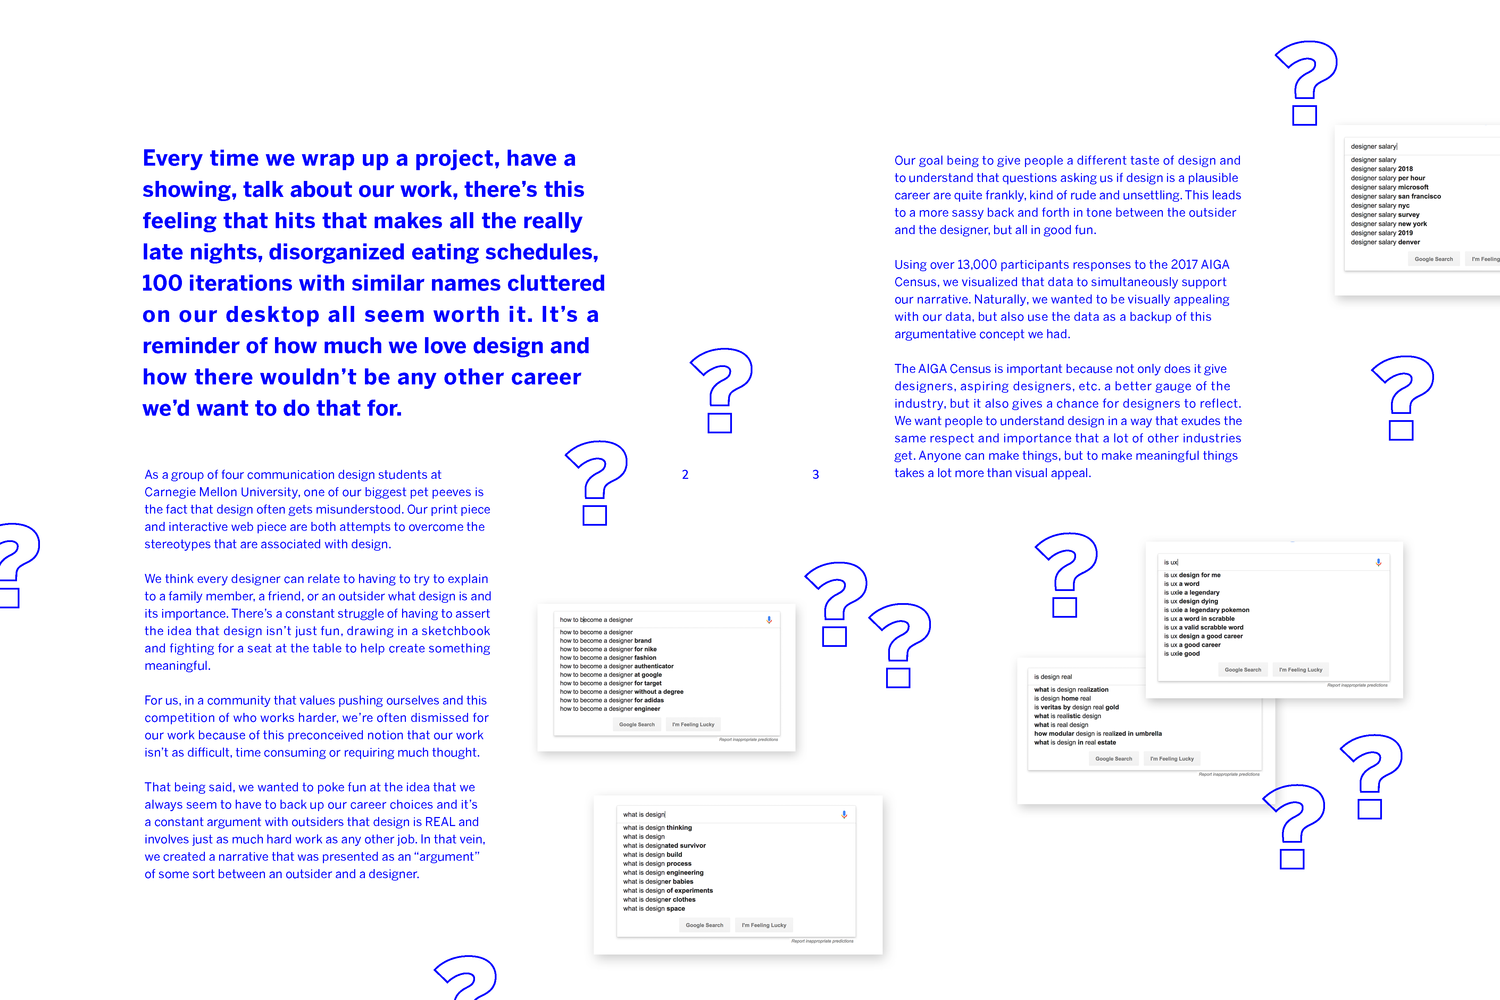

As a group of four communication design students at Carnegie Mellon University, one of our biggest pet peeves is the fact that design often gets misunderstood. Using over 13,000 participant responses to the 2017 AIGA Census, we visualized that data to simultaneously support a narrative we created between a designer and an "outsider" to emphasize the importance and nuances of design. This idea of having to try to explain to a family member, a friend, or an outside what design is felt like something that was relatable to anyone within the field. Both the print piece and interactive web piece serve as our way to break the connotations and stereotypes that are often associated with design.
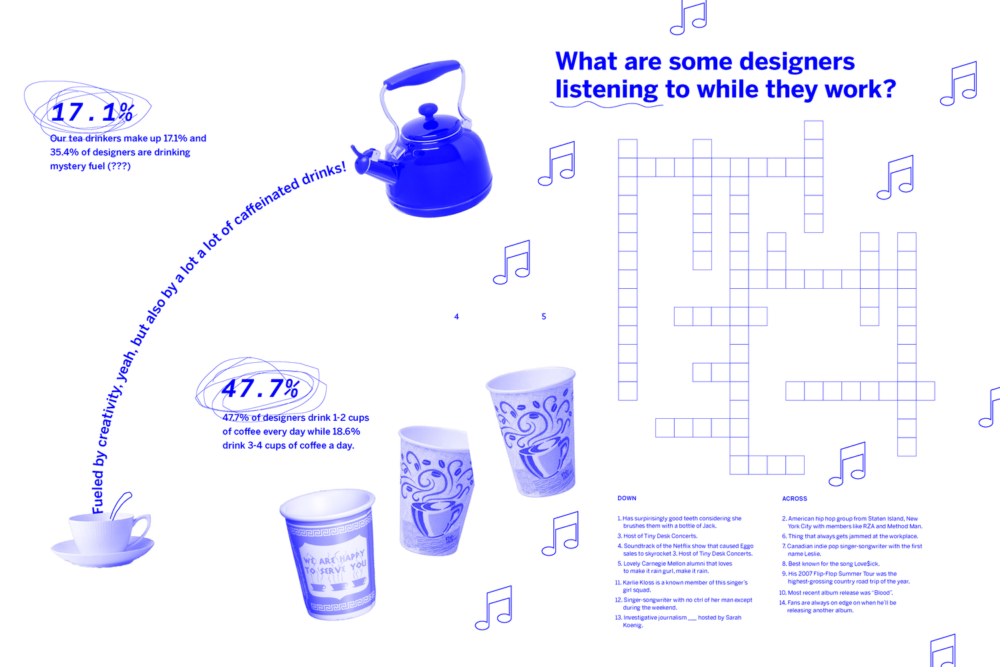
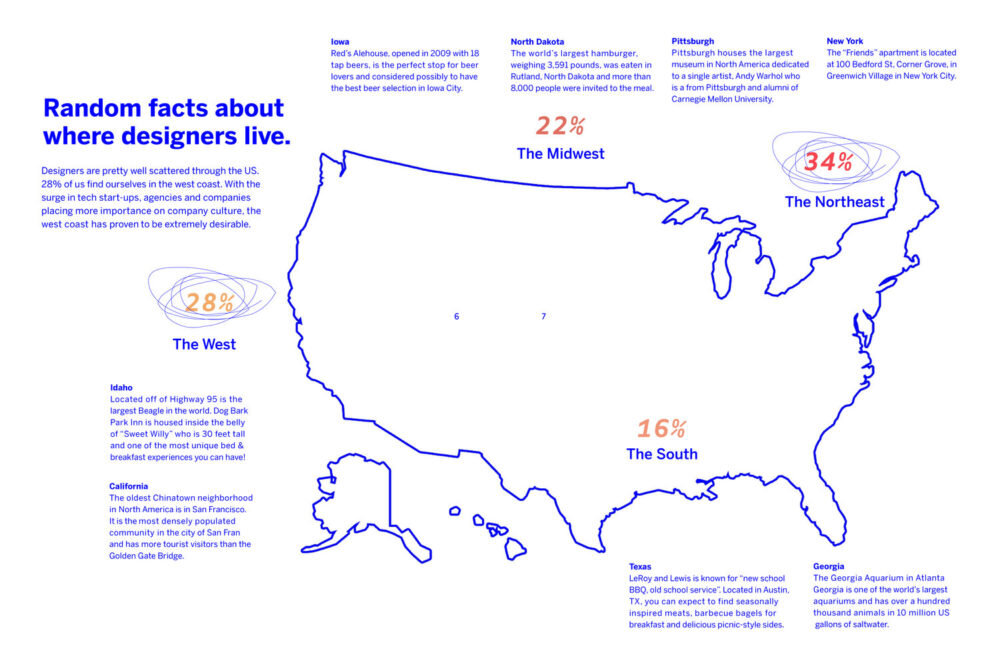
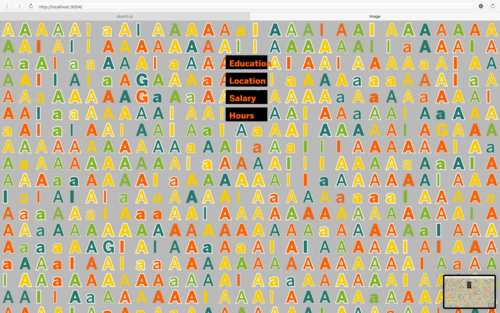
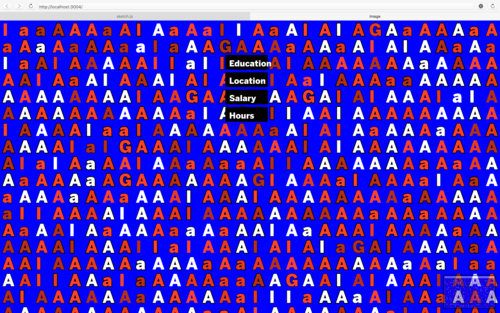
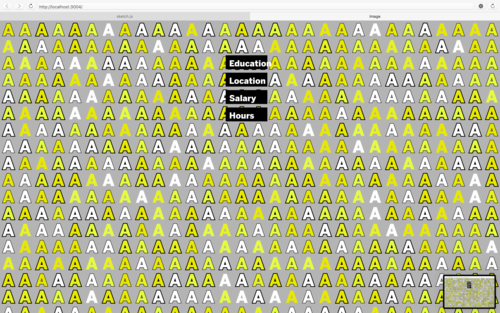
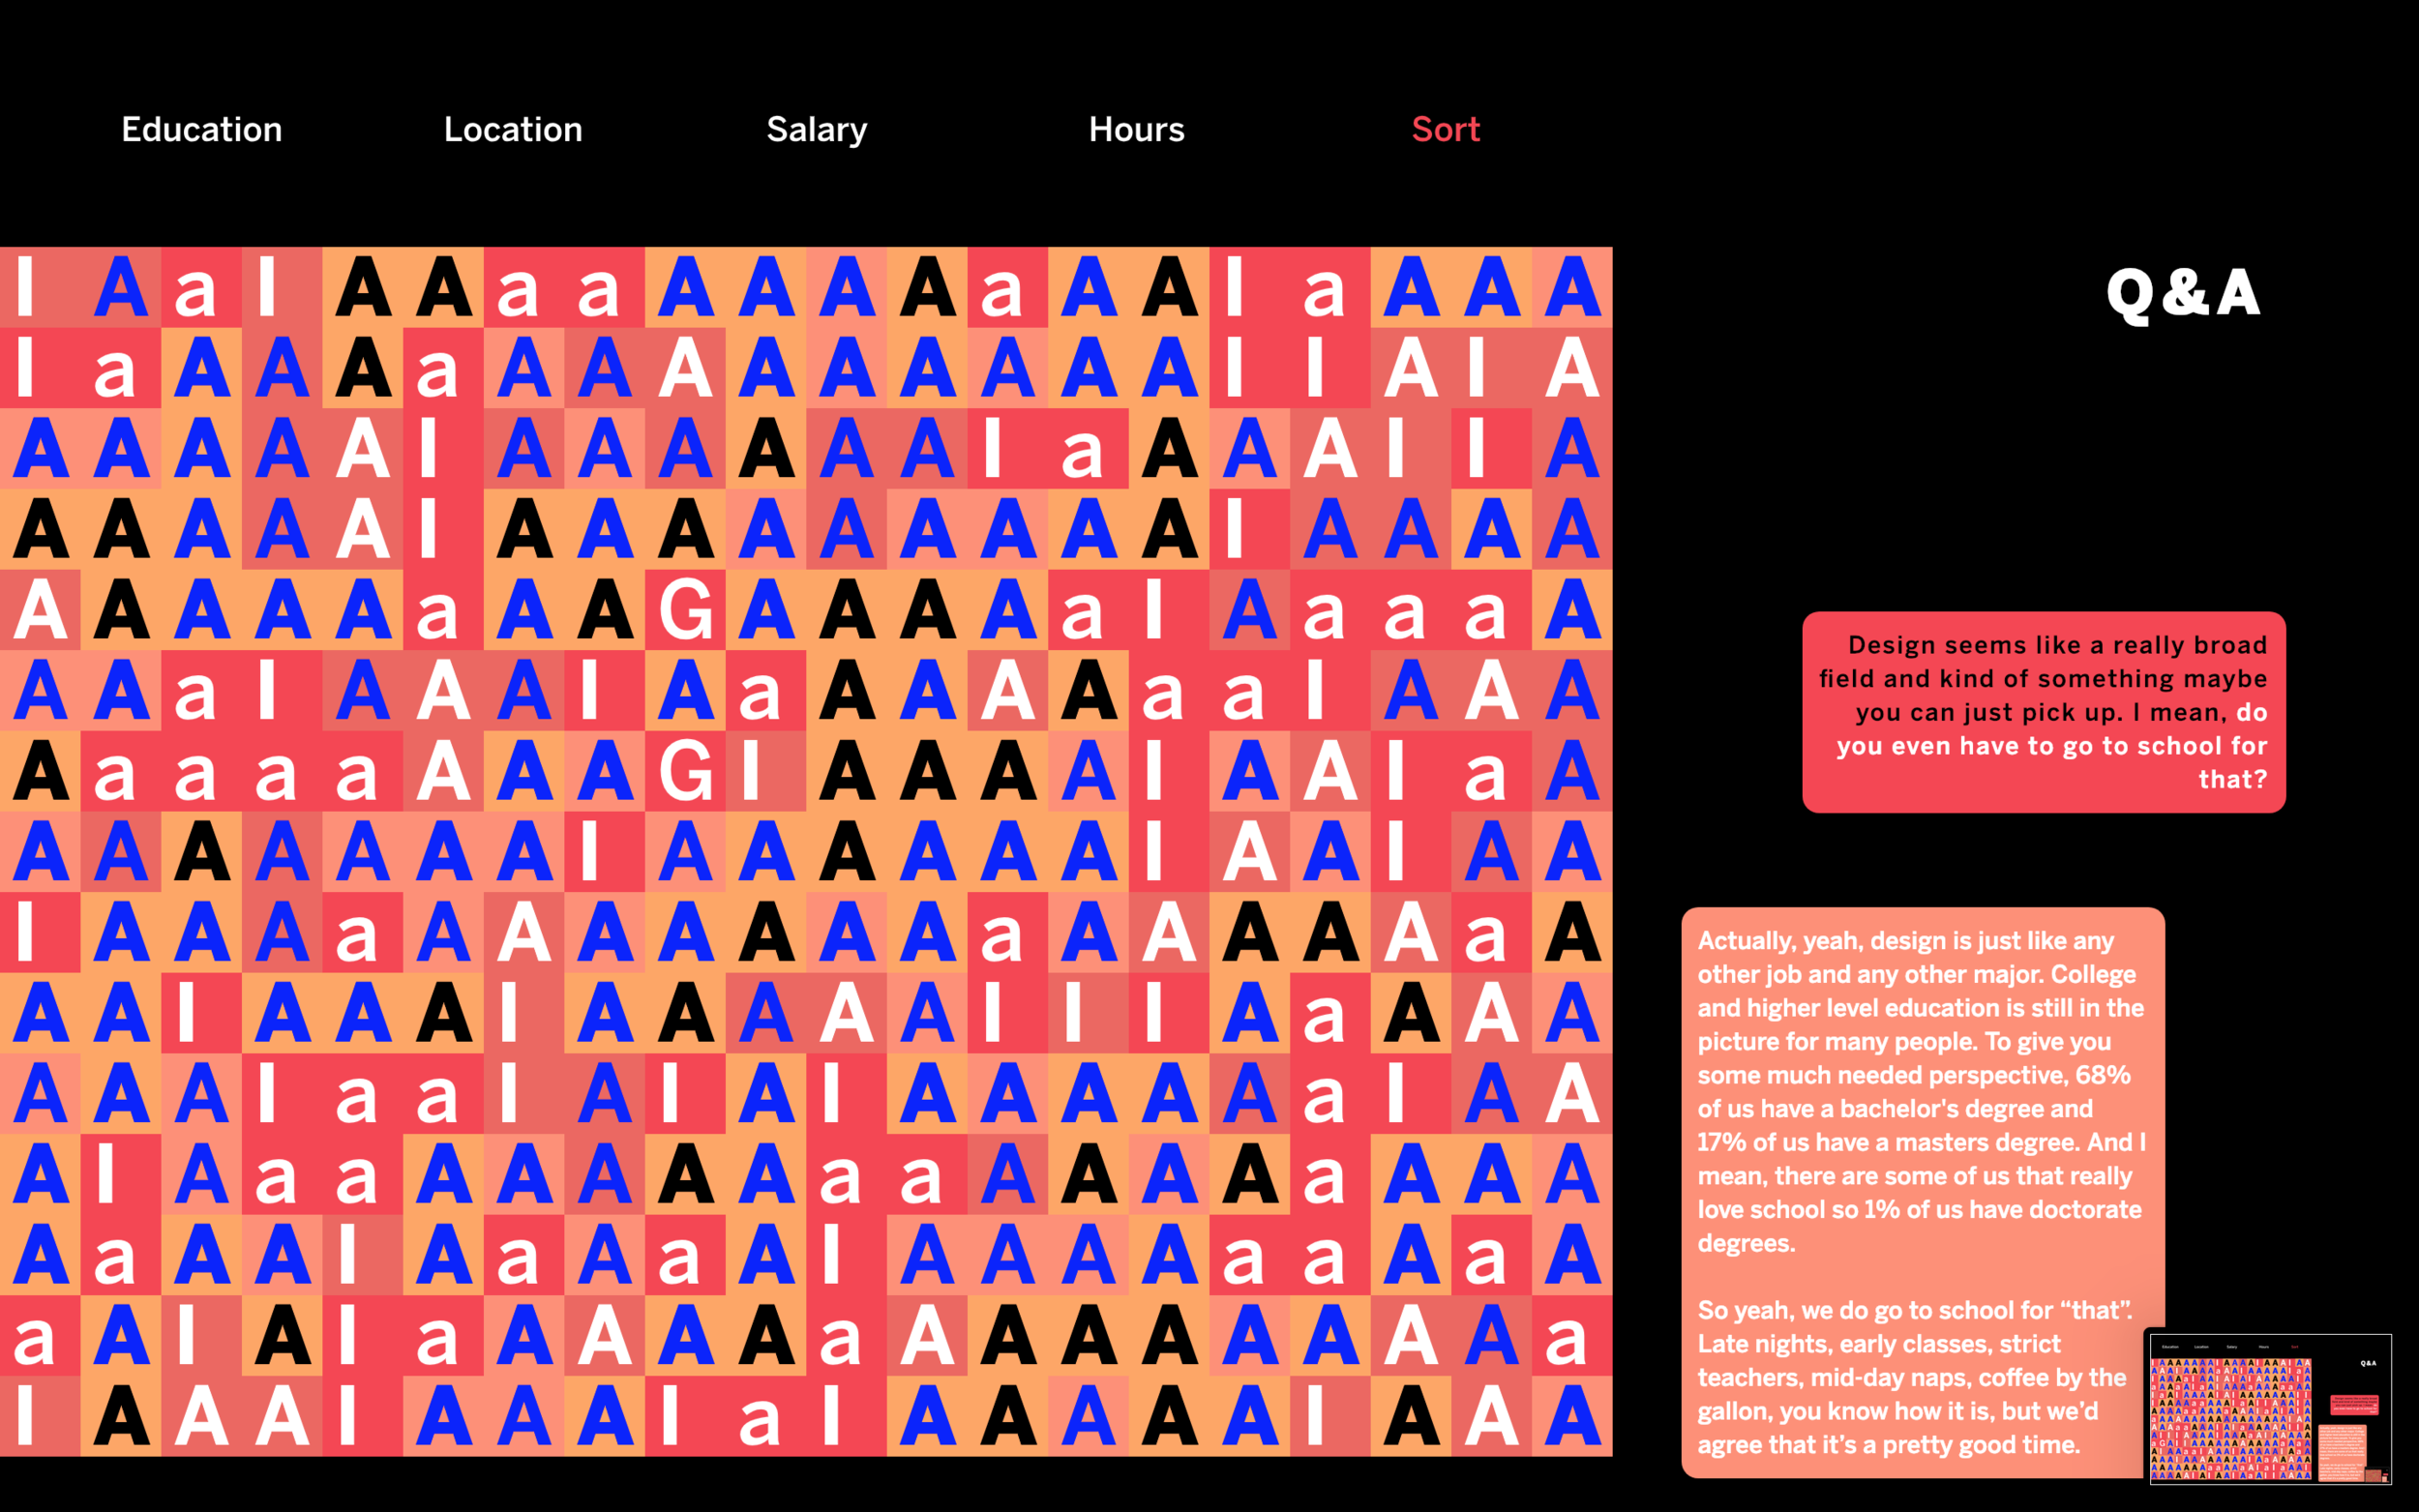
Our web piece has more generalized data, looking at things like education level, salary level, location and hours working while we wanted our print piece to be way more personable and highlight things like music designers were listening to or cups of coffee they were drinking. Above all, we wanted to make the overall vibe to be kind of sassy and light-hearted. The copy attempts to do that with this bantering back and forth, while the data visualization is meant to be engaging, visually appealing and also incite further exploration.
WHAT I DID 🙋🏻
- Concept development
- Writing all of the copy for both print + web
- Creating a visual system foundation
- Analyzing data from sections we chose
- Creating visuals + direction for print piece spreads
- Self apppointed team mascot (woo!)
Project Info

Interactive Website — click to explore the site for more details!
Interactive Web Piece
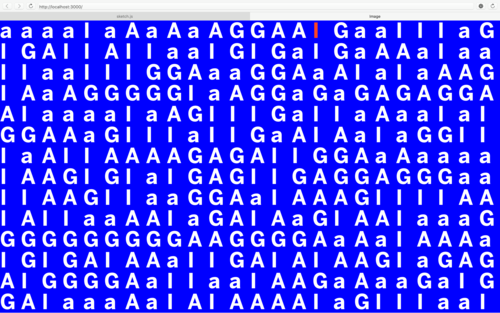
The interactive web piece features a narrative, written in a Q&A style, that the user can read through and then play around with the data visualization chart created. After the landing page, the website features a key on how to read the data shown and the user can toggle through different options to see how the data changes.

There were features that we wanted to be a part of the web piece, but weren’t able to code them based on time and ability constraints. We mocked up a version of it in After Effects to show what it would’ve to look like and how it would’ve functioned
Website Walk-through
The 2017 AIGA Census had over 13,000 participants. We downloaded the raw data and looked at everything through an excel sheet first. We all individually pulled out categories that we were interested in and then touched base to see which overlapping ones we had. We eventually settled on 14 categories (that can be seen through our web + print piece). After this step, we put the quantitative numbers into pie charts just for us to digest easier and keep organized.
Design Process
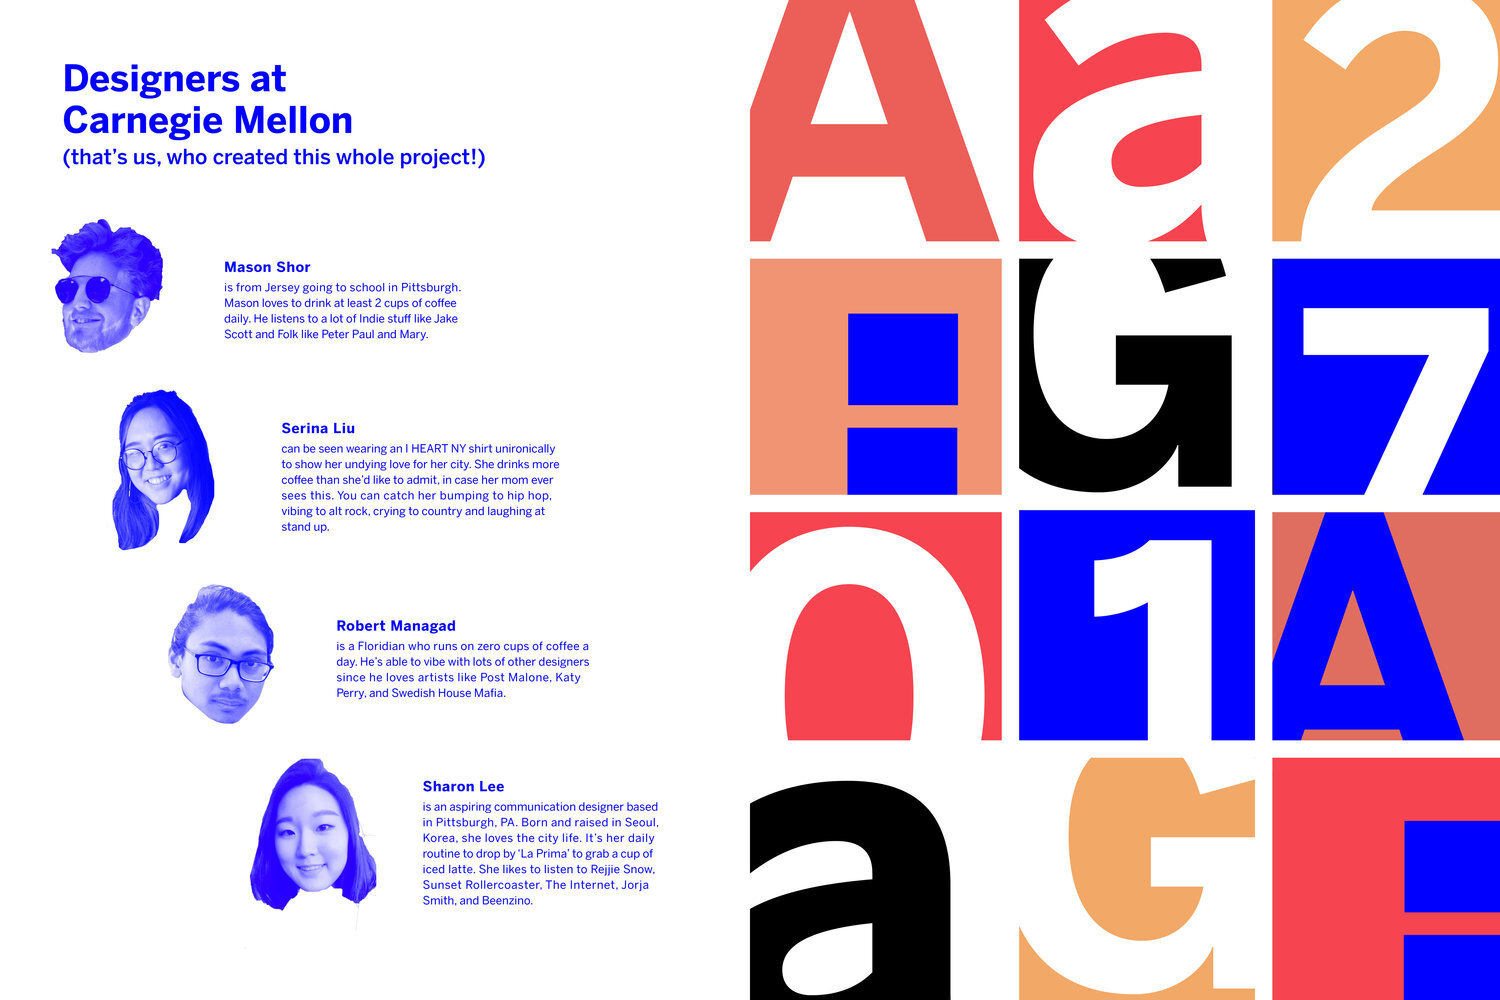
Group Members: Mason Young-Shor, Robert Managad and Sharon Lee


Copy was an important component of the deliverables because it was meant to set the tone for the entire piece while still weaving the data into it. I enjoyed writing in the voice of a designer trying to explain my career choice and my practice because it’s a conversation that I am incredibly well-versed in. Through the copy, it was also an opportunity to create a personality that would engage in some repertoire and to help further humanize this dense data.
In terms of visual identity for the web and print piece, we iterated through many colors (select few shown below) and looked at different typefaces to find one that we felt captured the voice of our project best.


Typeface style sheet


Me @ Thanksgiving